라이브커머스 주문 시스템 개선기 - 튜닝 & 장애조치
이번 단계의 목표는 오픈런과 같은 순간적으로 트래픽이 몰리는 상황에서도 주문 API 응답을 3초 이내로 유지하는 것이었다.
앞선 테스트에서 Redis Lua Script와 Bull Queue를 적용해 재고 정합성은 확보했지만, 주문 요청이 몰리는 구간에서는 여전히 응답시간이 3초를 초과하는 경우가 발생했다.
따라서 이번에는 Bull Queue Worker의 concurrency 값을 조정하며 처리량과 응답시간 변화를 측정하였다.
worker의 concurrency 조정 :
- 5
█ THRESHOLDS
http_req_failed
✓ 'rate<0.20' rate=0.00%

openrun_5xx_count
✓ 'count<10' count=0

openrun_duration_ms
✗ 'p(95)<3000' p(95)=5.43s

openrun_success_rate
✓ 'rate>0.70' rate=100.00%

poller_api_success
✓ 'rate>0.95' rate=100.00%
█ TOTAL RESULTS
checks_total.......: 61637   243.26439/s
checks_succeeded...: 100.00% 61637 out of 61637
checks_failed......: 0.00%   0 out of 61637

✓ [S3 poller] 200
✓ login 200
✓ login has token
✓ [S3] 주문 성공 또는 정상 품절
✓ [S3] 서버 에러 없음

CUSTOM
openrun_5xx_count..............: 0       0/s
openrun_duration_ms............: avg=2.15s    min=7ms    med=1.45s  max=8.22s  p(90)=5.09s  p(95)=5.43s
openrun_success_rate...........: 100.00% 5451 out of 5451
poller_api_success.............: 100.00% 48335 out of 48335

HTTP
http_req_duration..............: avg=703.33ms min=2.28ms med=4.73ms max=7.99s  p(90)=2.86s  p(95)=4.43s
  { expected_response:true }...: avg=703.33ms min=2.28ms med=4.73ms max=7.99s  p(90)=2.86s  p(95)=4.43s
http_req_failed................: 0.00%   0 out of 61023
http_reqs......................: 61023   240.8411/s

EXECUTION
iteration_duration.............: avg=12.42s   min=1.15s  med=12.52s max=23.33s p(90)=14.84s p(95)=15.93s
iterations.....................: 53786   212.278639/s
vus............................: 6       min=0              max=4387
vus_max........................: 5200    min=1275           max=5200

NETWORK
data_received..................: 220 MB  867 kB/s
data_sent......................: 13 MB 51 kB/s- 10
█ THRESHOLDS
http_req_failed
✓ 'rate<0.20' rate=0.00%

openrun_5xx_count
✓ 'count<10' count=0

openrun_duration_ms
✗ 'p(95)<3000' p(95)=3.01s

openrun_success_rate
✓ 'rate>0.70' rate=100.00%

poller_api_success
✓ 'rate>0.95' rate=100.00%
█ TOTAL RESULTS
checks_total.......: 68721   270.463971/s
checks_succeeded...: 100.00% 68721 out of 68721
checks_failed......: 0.00%   0 out of 68721

✓ [S3 poller] 200
✓ login 200
✓ login has token
✓ [S3] 주문 성공 또는 정상 품절
✓ [S3] 서버 에러 없음

CUSTOM
openrun_5xx_count..............: 0       0/s
openrun_duration_ms............: avg=1.23s    min=8ms    med=971ms  max=4.7s   p(90)=2.75s  p(95)=3.01s
openrun_success_rate...........: 100.00% 8731 out of 8731
poller_api_success.............: 100.00% 48859 out of 48859

HTTP
http_req_duration..............: avg=480.83ms min=2.29ms med=4.75ms max=4.7s   p(90)=1.99s  p(95)=2.49s
  { expected_response:true }...: avg=480.83ms min=2.29ms med=4.75ms max=4.7s   p(90)=1.99s  p(95)=2.49s
http_req_failed................: 0.00%   0 out of 68400
http_reqs......................: 68400   269.200617/s

EXECUTION
iteration_duration.............: avg=11.61s   min=1.08s  med=12.29s max=19.92s p(90)=14.67s p(95)=14.97s
iterations.....................: 57590   226.6559/s
vus............................: 2       min=0              max=4461
vus_max........................: 5200    min=1461           max=5200

NETWORK
data_received..................: 324 MB  1.3 MB/s
data_sent......................: 14 MB 55 kB/s- 15
█ THRESHOLDS
http_req_failed
✓ 'rate<0.20' rate=0.00%

openrun_5xx_count
✓ 'count<10' count=0

openrun_duration_ms
✗ 'p(95)<3000' p(95)=7.13s

openrun_success_rate
✓ 'rate>0.70' rate=100.00%

poller_api_success
✓ 'rate>0.95' rate=100.00%
█ TOTAL RESULTS
checks_total.......: 57265   226.085699/s
checks_succeeded...: 100.00% 57265 out of 57265
checks_failed......: 0.00%   0 out of 57265

✓ [S3 poller] 200
✓ login 200
✓ login has token
✓ [S3] 주문 성공 또는 정상 품절
✓ [S3] 서버 에러 없음

CUSTOM
openrun_5xx_count..............: 0       0/s
openrun_duration_ms............: avg=2.97s    min=7ms    med=2.45s  max=10.88s p(90)=5.5s   p(95)=7.13s
openrun_success_rate...........: 100.00% 3656 out of 3656
poller_api_success.............: 100.00% 47553 out of 47553

HTTP
http_req_duration..............: avg=745.95ms min=2.34ms med=4.61ms max=10.74s p(90)=2.86s  p(95)=4.69s
  { expected_response:true }...: avg=745.95ms min=2.34ms med=4.61ms max=10.74s p(90)=2.86s  p(95)=4.69s
http_req_failed................: 0.00%   0 out of 56460
http_reqs......................: 56460   222.90751/s

EXECUTION
iteration_duration.............: avg=13.02s   min=1.05s  med=12.77s max=33.78s p(90)=15.17s p(95)=18.17s
iterations.....................: 51209   202.176243/s
vus............................: 5       min=0              max=4400
vus_max........................: 5200    min=903            max=5200

NETWORK
data_received..................: 162 MB  641 kB/s
data_sent......................: 12 MB 49 kB/s- 20
█ THRESHOLDS
http_req_failed
✓ 'rate<0.20' rate=0.00%

openrun_5xx_count
✓ 'count<10' count=0

openrun_duration_ms
✗ 'p(95)<3000' p(95)=7.23s

openrun_success_rate
✓ 'rate>0.70' rate=100.00%

poller_api_success
✓ 'rate>0.95' rate=100.00%
█ TOTAL RESULTS
checks_total.......: 58996   232.082915/s
checks_succeeded...: 100.00% 58996 out of 58996
checks_failed......: 0.00%   0 out of 58996

✓ [S3 poller] 200
✓ login 200
✓ login has token
✓ [S3] 주문 성공 또는 정상 품절
✓ [S3] 서버 에러 없음

CUSTOM
openrun_5xx_count..............: 0       0/s
openrun_duration_ms............: avg=2.91s    min=10ms   med=2.25s  max=10.28s p(90)=6.22s  p(95)=7.23s
openrun_success_rate...........: 100.00% 4599 out of 4599
poller_api_success.............: 100.00% 47398 out of 47398

HTTP
http_req_duration..............: avg=956.62ms min=2.33ms med=4.95ms max=10.36s p(90)=3.81s  p(95)=5.55s
  { expected_response:true }...: avg=956.62ms min=2.33ms med=4.95ms max=10.36s p(90)=3.81s  p(95)=5.55s
http_req_failed................: 0.00%   0 out of 58274
http_reqs......................: 58274   229.242657/s

EXECUTION
iteration_duration.............: avg=12.97s   min=1.38s  med=12.77s max=27.91s p(90)=15.54s p(95)=18.04s
iterations.....................: 51997   204.549721/s
vus............................: 1       min=0              max=4453
vus_max........................: 5200    min=1246           max=5200

NETWORK
data_received..................: 192 MB  756 kB/s
data_sent......................: 13 MB   50 kB/s
이번 테스트를 통해 단순히 Worker 수를 늘리는 것이 항상 성능 향상으로 이어지는 것은 아니라는 점을 확인하였다.
Concurrency 5 구간에서는 Queue 처리 속도가 병목으로 작용했지만, Concurrency를 10까지 증가시키면서 Queue 대기시간이 크게 감소하였다.
반면 Concurrency를 15 이상으로 증가시키자 DB 동시 접근이 급격히 증가하면서 새로운 병목이 발생하였다.
특히 주문 처리 과정에서 수행되는 재고 차감, 주문 생성, 주문 상세 저장, 결제 금액 계산 등의 작업이 동시에 수행되면서 DB 경합 비용이 증가한 것으로 판단된다.
결과적으로 현재 구조에서는 concurrency = 10이 가장 안정적인 설정값이었으며, 오픈런 상황에서도 P95 3.01초 수준의 응답시간을 확보할 수 있었다.
high-stock 테스트 / Queue Drain
concurrency = 10high-stock 테스트 실행중

- Queue Drain 완료

- 확인 코드
// Queue backlog 감시 — 30초마다 적체 여부 확인
    // PM2 인스턴스 0번만 실행 (중복 로그 방지)
    @Interval(30000)
    async handleBacklogCheck() {
        if (process.env.NODE_APP_INSTANCE !== '0') return;

        const [waiting, active, delayed] = await Promise.all([
            this.orderQueue.getWaitingCount(),
            this.orderQueue.getActiveCount(),
            this.orderQueue.getDelayedCount(),
        ]);

        const total = waiting + active + delayed;

        if (total >= BACKLOG_WARN_THRESHOLD) {
            if (!this.backlogStartedAt) {
                this.backlogStartedAt = new Date();
                this.logger.warn(

                    `[Queue Backlog] 적체 — ` +
                    `waiting:${waiting} active:${active} delayed:${delayed} total:${total}`
                );
            } else {
                const elapsedSec = Math.round((Date.now() - this.backlogStartedAt.getTime()) / 1000);
                this.logger.warn(
                    `[Queue Backlog] 적체 지속 ${elapsedSec}초 — ` +
                    `waiting:${waiting} active:${active} delayed:${delayed} total:${total}`
                );
            }
        } else if (this.backlogStartedAt) {
            const elapsedSec = Math.round((Date.now() - this.backlogStartedAt.getTime()) / 1000);
            this.backlogStartedAt = null;
            this.logger.log(
                `[Queue Backlog] 해소 완료 — 소요시간: ${elapsedSec}초 | ` +
                `waiting:${waiting} active:${active} delayed:${delayed}`
            );
        }
}- 외부 모니터링을 사용해서 확인하는 것이 좋으나, 현실적인 문제로 30초 보다 Queue 적체가 50건이상일때 로그를 찍게 해놓았다.
테스트 결과
█ THRESHOLDS
http_req_duration{endpoint:live_status}
✓ 'p(95)<3000' p(95)=1.98s

http_req_duration{endpoint:order}
✓ 'p(95)<3000' p(95)=2.2s

http_req_failed
✓ 'rate<0.05' rate=0.00%

order_duration_ms
✓ 'p(95)<3000' p(95)=2.26s

order_fast_rate
✓ 'rate>0.85' rate=99.18%

order_success_rate
✓ 'rate>0.95' rate=99.99%

poller_api_success
✓ 'rate>0.99' rate=100.00%
█ TOTAL RESULTS
checks_total.......: 353605 576.712695/s
checks_succeeded...: 99.72% 352626 out of 353605
checks_failed......: 0.27%  979 out of 353605

✓ [S5 poller] 200
✓ login 200
✓ login has token
✗ [S5] 주문 성공
  ↳  99% — ✓ 118902 / ✗ 7
✗ [S5] 주문 3초 이내
  ↳  99% — ✓ 117937 / ✗ 972

CUSTOM
order_duration_ms..............: avg=813.36ms min=5ms    med=596ms    max=4.04s p(90)=1.99s  p(95)=2.26s
order_fast_count...............: 117937  192.349557/s
order_fast_ms..................: avg=791.61ms min=5ms    med=582ms    max=2.99s p(90)=1.95s  p(95)=2.21s
order_fast_rate................: 99.18%  117937 out of 118909
order_slow_count...............: 972     1.585285/s
order_slow_ms..................: avg=3.45s    min=3s     med=3.45s    max=4.04s p(90)=3.78s  p(95)=3.89s
order_slow_rate................: 0.81%   972 out of 118909
order_success_rate.............: 99.99%  118902 out of 118909
order_tps......................: 118902  193.923425/s
poller_api_success.............: 100.00% 113387 out of 113387

HTTP
http_req_duration..............: avg=813.22ms min=2.35ms med=686.61ms max=4.04s p(90)=1.88s  p(95)=2.05s
  { endpoint:live_status }.....: avg=813.18ms min=2.35ms med=732.89ms max=3.94s p(90)=1.85s  p(95)=1.98s
  { endpoint:order }...........: avg=782.07ms min=5.55ms med=559.43ms max=4.04s p(90)=1.93s  p(95)=2.2s
  { expected_response:true }...: avg=813.21ms min=2.35ms med=686.61ms max=4.04s p(90)=1.88s  p(95)=2.05s
http_req_failed................: 0.00%   7 out of 364745
http_reqs......................: 364745  594.881497/s

EXECUTION
iteration_duration.............: avg=9.36s    min=2.01s  med=8.74s    max=19.8s p(90)=14.92s p(95)=15.69s
iterations.....................: 232296  378.863568/s
vus............................: 4       min=0                max=4000
vus_max........................: 4000    min=1435             max=4000

NETWORK
data_received..................: 3.9 GB  6.3 MB/s
data_sent......................: 45 MB   73 kB/s
concurrency = 15high-stock 테스트 실행중
█ THRESHOLDS
http_req_duration{endpoint:live_status}
✗ 'p(95)<3000' p(95)=3.83s

http_req_duration{endpoint:order}
✗ 'p(95)<3000' p(95)=3.91s

http_req_failed
✓ 'rate<0.05' rate=0.00%

order_duration_ms
✗ 'p(95)<3000' p(95)=4.03s

order_fast_rate
✗ 'rate>0.85' rate=83.90%

order_success_rate
✓ 'rate>0.95' rate=99.99%

poller_api_success
✓ 'rate>0.99' rate=100.00%
█ TOTAL RESULTS
checks_total.......: 282513 459.881617/s
checks_succeeded...: 95.11% 268714 out of 282513
checks_failed......: 4.88%  13799 out of 282513

✓ [S5 poller] 200
✓ login 200
✓ login has token
✗ [S5] 주문 성공
  ↳  99% — ✓ 85677 / ✗ 5
✗ [S5] 주문 3초 이내
  ↳  83% — ✓ 71888 / ✗ 13794

CUSTOM
order_duration_ms..............: avg=1.51s  min=4ms    med=1.15s    max=12.13s p(90)=3.5s   p(95)=4.03s
order_fast_count...............: 71888   117.021056/s
order_fast_ms..................: avg=1.05s  min=4ms    med=874.5ms  max=2.99s  p(90)=2.43s  p(95)=2.69s
order_fast_rate................: 83.90%  71888 out of 85682
order_slow_count...............: 13794   22.454213/s
order_slow_ms..................: avg=3.91s  min=3s     med=3.68s    max=12.13s p(90)=4.85s  p(95)=5.54s
order_slow_rate................: 16.09%  13794 out of 85682
order_success_rate.............: 99.99%  85677 out of 85682
order_tps......................: 85677   139.46713/s
poller_api_success.............: 100.00% 108749 out of 108749

HTTP
http_req_duration..............: avg=1.44s  min=1.87ms med=1.01s    max=11.88s p(90)=3.5s   p(95)=3.94s
  { endpoint:live_status }.....: avg=1.24s  min=1.87ms med=731.18ms max=11.88s p(90)=3.33s  p(95)=3.83s
  { endpoint:order }...........: avg=1.42s  min=3.63ms med=1.07s    max=11.35s p(90)=3.35s  p(95)=3.91s
  { expected_response:true }...: avg=1.44s  min=1.87ms med=1.01s    max=11.88s p(90)=3.5s   p(95)=3.94s
http_req_failed................: 0.00%   5 out of 290143
http_reqs......................: 290143  472.301919/s

EXECUTION
iteration_duration.............: avg=11.13s min=2.01s  med=11.64s   max=26.25s p(90)=15.94s p(95)=16.97s
iterations.....................: 194431  316.499569/s
vus............................: 1       min=0                max=4000
vus_max........................: 4000    min=668              max=4000

NETWORK
data_received..................: 2.8 GB  4.5 MB/s
data_sent......................: 35 MB   58 kB/s
Worker Concurrency를 5, 10, 15 으로 변경하며 반복 측정한 결과, Concurrency 10에서 가장 높은 처리량(TPS)과 가장 낮은 응답시간을 기록하였다.
이후 Concurrency를 15 이상으로 증가시키자 오히려 TPS는 감소하고 응답시간은 증가하였다.
Bull Worker가 동시에 더 많은 Job을 수행하면서 동시에 실행되는 Transaction 수도 증가하였다.
이로 인해 MySQL Connection Pool 사용량 증가, Row Lock 경쟁 증가, Commit 대기 증가로 이어져 결과적으로 Queue 대기시간은 줄었지만 DB 처리시간이 증가하여 전체 응답시간은 오히려 악화되었다.
이는 단순히 Worker 수를 늘리는 것이 성능 향상으로 이어지지 않으며, DB Connection 경쟁과 Transaction 처리 비용 증가로 인해 오히려 병목이 발생할 수 있음을 보여준다.
따라서 현재 c7i.xlarge 환경에서는 Concurrency 10이 최적의 설정값으로 판단하였다.
Redis Reconnect : 테스트 실행 중 임의로 레디스의 연결을 끝어 낸 후, 재연결

“프라이머리 장애조치 항목” 로 재연결 테스트를 진행했다.

각 노드 에서 레디스 연결 오류 발생
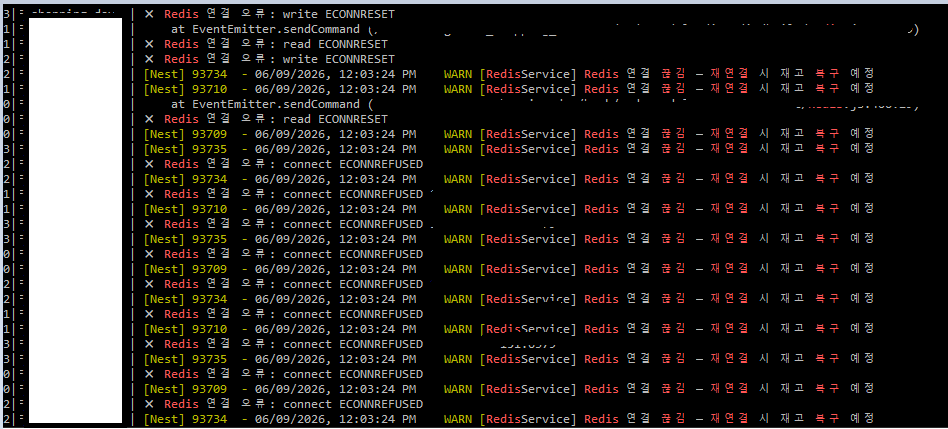
레디스의 재연결을 감지하고 재고 키 를 복구 한다


Redis 재연결 시 재고 복구 로직이 Queue 처리보다 먼저 실행되면서 Redis와 DB 재고가 일시적으로 불일치했다.

Queue의 적체 시작 및 해소 되었다

job 획득에 최종 실패 및 oversell 리스크 감지

Queue가 아직 DB 재고를 차감 중인데 복구 함수가 Redis를 DB 값으로 덮어썼다.
수정 후
재고 복구 함수 내에서 기존의 실행 및 대기중이던 Queue가 완전히 소진 될 대까지 대기 후 → DB 의 값이 정확 해진 뒤에 Redis의 재고를 복구한다.
waitForQueueDrain() 으로 모든 Queue가 소진된 후 Redis 재고를 복구하도록 수정하였다.


//redisService

   // 재연결 시 실행할 핸들러 등록 (ProductService에서 호출)
    registerReconnectHandler(handler: () => Promise<void>) {
        this._reconnectHandlers.push(handler);
    }


 // close: TCP 연결 끊김 (Redis 재시작 또는 네트워크 단절)
        this.client.on('close', () => {
            this._wasDisconnected = true;
            this.logger.warn('Redis 연결 끊김 — 재연결 시 재고 복구 예정');
        });

        // ready: 재연결 완료
        this.client.on('ready', async () => {
            // Redis 재시작 시 SHA 초기화 → 항상 재로드
            await this.loadLuaScript().catch(e =>
                this.logger.error(`Lua 스크립트 재로드 실패: ${e.message}`)
            );

            if (!this._wasDisconnected) return;  // 최초 연결이면 여기서 종료

            this._wasDisconnected = false;
            this.logger.warn('Redis 재연결 감지 → 재고 복구 핸들러 실행');

            for (const handler of this._reconnectHandlers) {
                //restoreStockForActiveLives() 실행됨
                await handler().catch(e =>
                    this.logger.error(`재고 복구 실패: ${e.message}`)
                );
            }
        });
// Redis 재연결 시 재고 복구 핸들러 등록
onModuleInit() {
//콜백
this.redisService.registerReconnectHandler(() => this.restoreStockForActiveLives());
}
async restoreStockForActiveLives(): Promise<void> {
// Queue 적체가 남아있으면 DB가 아직 최신값이 아님 → 소진 후 복구
await this.waitForQueueDrain();
//복구 로직 및 예외처리 작성
}
worker kill : 테스트 실행 중, 임의로 pm2 restart
async function bootstrap() {
  const app = await NestFactory.create(AppModule);
  app.enableShutdownHooks(); //애플리케이션이 종료될 때 종료 이벤트 캐치
  }
      //ecosystem.config.js
      kill_timeout: 10000, //pm2 가 종료 신호 보낸 뒤 최대 10초 기다림
// 주문 모듈
BullModule.registerQueue({
name: 워커 이름,
settings: {
//"주문 Job의 최대 처리시간 × 2~3배
lockDuration: 30000, // Job 처리 최대 시간 (30초) — 초과 시 stalled 처리
stalledInterval: 5000, // stalled job 체크 주기 (5초)
maxStalledCount: 1, // stalled 허용 횟수 — 초과 시 failed 처리
},
}),재시작


pid=35955 msg=failed to kill - retrying in 100ms ← kill_timeout 작동 중
2|| ERROR [CRITICAL] Job 최종 실패 — attempts:3/3
error:Connection is not established with mysql database
2|| ERROR [verifyStock 실패] live:77 Connection is not established with mysql database
App [:2] exited with code [0] via signal [SIGINT] ← 정상 종료
분석 결과 TypeORM이 먼저 종료되면서 DB Connection이 닫혔지만, Bull Queue는 아직 처리 중인 Job을 계속 수행하려고 시도하고 있었다.
이 경우 Redis 재고는 이미 차감되었지만 DB 저장은 실패할 수 있으며, 주문 유실 가능성이 존재했다.
종료 순서가 TypeORM 종료 → Bull Queue 처리 중 → DB 저장 실패
즉, Queue보다 DB가 먼저 종료되고 있었다. Worker Kill 시점에 in-flight 상태였던 주문은 유실된다
NestJS의 BeforeApplicationShutdown훅을 이용하여 Queue를 먼저 종료하도록 수정하였다.
@Processor()
export class Processor implements BeforeApplicationShutdown{

    constructor(
        @InjectQueue(QUEUE) private readonly queue: Queue,
    ) { }

     async beforeApplicationShutdown(signal?: string) {
        this.logger.warn(`[Shutdown] ${signal} 수신 → Queue 종료 대기 (진행 중인 Job 완료 후 종료)`);
        try {
            await this.orderQueue.close();
            this.logger.warn('[Shutdown] Queue 정상 종료 완료');
        } catch (e) {
            this.logger.error(`[Shutdown] Queue 종료 실패: ${e.message}`);
        }
    }

    @Process()
    async processOrder() {

    }

    }
1. onModuleDestroy
2. beforeApplicationShutdown ← queue.close() (TypeORM보다 먼저)
3. onApplicationShutdown ← TypeORM 종료


beforeApplicationShutdown이 TypeORM보다 먼저 실행되어, DB가 닫히기 전에 in-flight Job이 모두 완료 후, 정상적으로 Queue가 종료 된것을 확인 할 수 있다
결과
이번 개선의 목적은 단순히 주문 처리 속도를 높이는 것이 아니었다.
라이브커머스 특성상 특정 순간에 수백~수천 명의 사용자가 동시에 주문을 시도할 수 있으며, 이 과정에서 과매도(Oversell), 재고 불일치, Queue 적체, Worker 장애와 같은 문제가 발생할 수 있다.
Redis Lua Script를 이용한 원자적 재고 선점, Bull Queue 기반 비동기 처리, Idempotency 적용을 통해 대량 동시 주문 환경에서도 재고 정합성을 유지할 수 있는 구조를 구축하였다.
또한 Redis 재연결, Queue Drain, Worker 강제 종료와 같은 장애 상황을 직접 재현하며 운영 환경에서 발생할 수 있는 문제를 검증하고 보완하였다.
특히 Concurrency 튜닝 과정에서는 Worker 수를 단순히 증가시키는 것이 항상 성능 향상으로 이어지지 않는다는 점을 확인하였으며, 현재 c7i.xlarge 환경에서는 Concurrency 10이 가장 안정적인 설정값임을 확인하였다.
결과적으로 이번 개선을 통해 주문 처리 성능뿐 아니라 장애 상황에서도 정합성과 안정성을 유지할 수 있는 운영 가능한 구조를 구축할 수 있었다.
'TECH > Backend' 카테고리의 다른 글
| 라이브 커머스 주문 시스템 개선기 - 테스트용 서버 사양도 확인하자 (0) | 2026.07.27 |
|---|---|
| 라이브커머스 주문 시스템 개선기 - DB 병목을 해결했더니 CPU가 죽었다(3) (0) | 2026.06.22 |
| 라이브커머스 주문 시스템 개선기 - DB 병목을 해결했더니 CPU가 죽었다(2) (0) | 2026.06.05 |
| 라이브커머스 주문 시스템 개선기 - DB 병목을 해결했더니 CPU가 죽었다(1) (0) | 2026.06.05 |
| 라이브커머스 주문 시스템 개선기 - Cooldown, Redis Lua, Queue로 동시성 문제 해결하기 (0) | 2026.05.22 |